NFL Player Projection Models: Intro & Test Data
How we project America's most popular sport.


We are excited to introduce our NFL player props for the 2024 season.
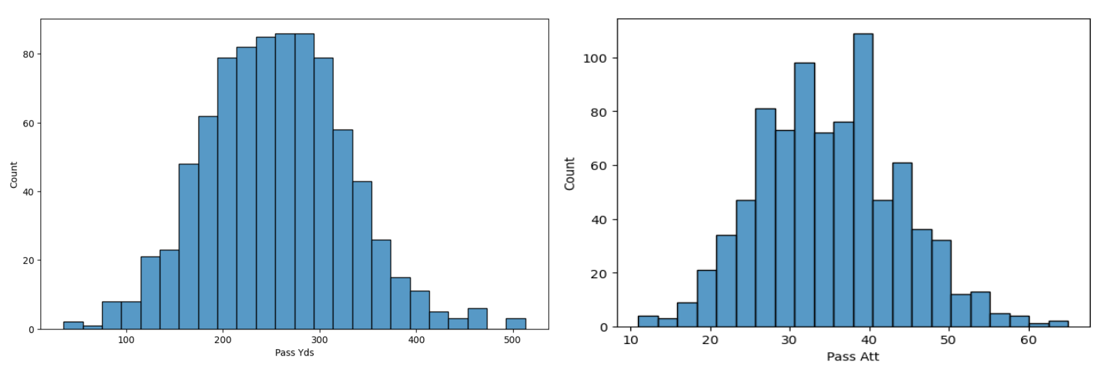
Our two most important projections start at the top with quarterback passing yards and passing attempts. Targeting these variables has the dual advantage of being relatively stable between games and normally distributed (see graphic below).
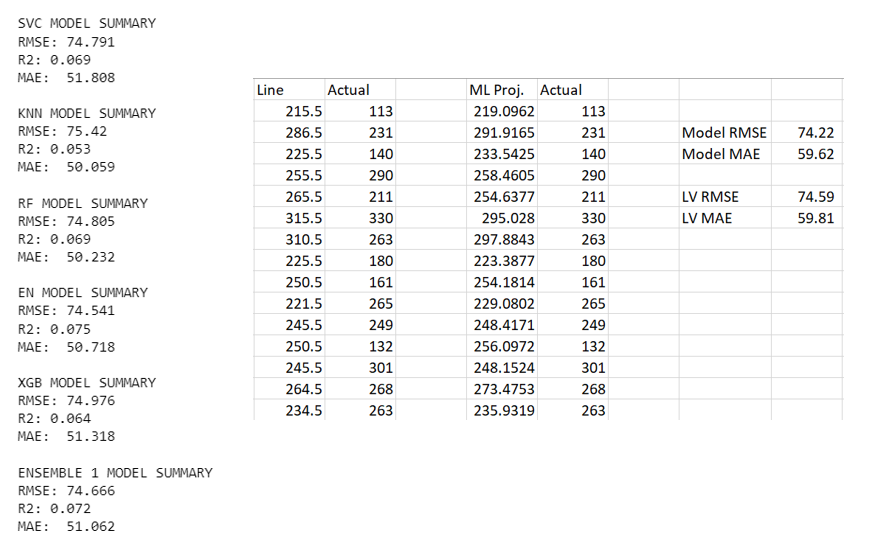
Our model utilizes an elastic net with 31 features to generate each projection.
Both player and season variables are included, as well as game specific data such as opponent matchups and weather conditions. Out of sample testing suggests it is even more accurate than book lines, which is very difficult to achieve across a full 500+ game sample (model comparison and summary statistics for the final passing yards model performance shown below).
Below these two core elastic nets sit a variety of simpler random forest models that are used in conjunction with season averages in a dynamic weighting scheme to project the other component values needed to arrive at all major statistical line item predictions. For example, predicting the quarterback completions market is a function of passing attempts and the completion percentage component prediction. A receiver’s reception projection is a function of pass attempts and the target share and catch rate components, and so on. The methods to convert the projections into probabilities vary by market, as the distributions from various stat items take a wide range of shapes. Compare receptions data below, and also note the subtle differences between projecting for a wide receiver versus a running back.
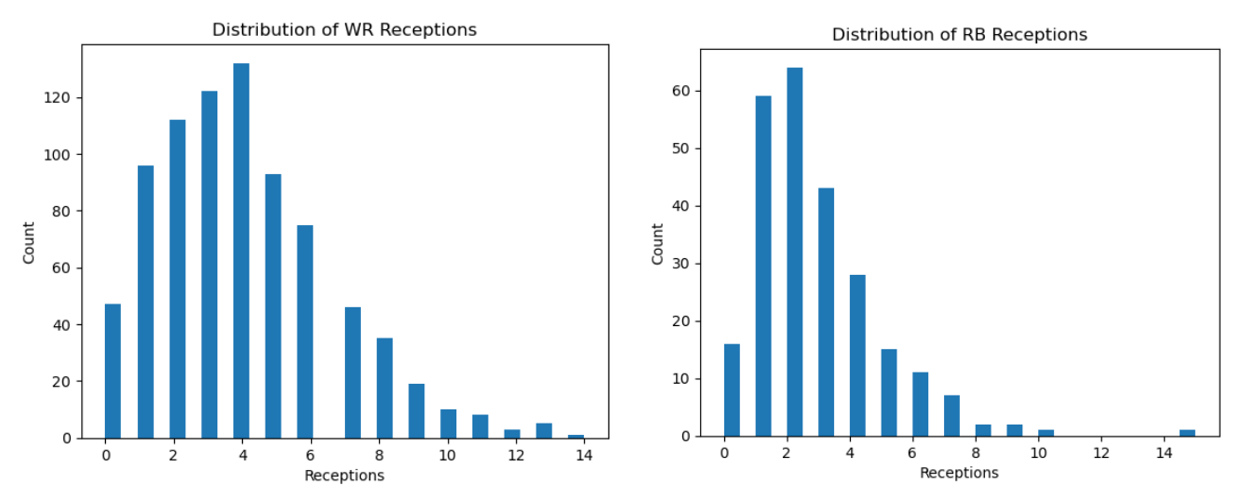
In total, 6 different distributions are used, and several of the models utilize an average of several different systems to arrive at a final probability.
From there, as with all our other models, the Kelly Criterion is applied to arrive at a suggested bet size. We then test on out-of-sample data to determine the thresholds across edge, EV, and suggested bet size that maximize profitability. Models which manage to achieve profitability levels that reach statistical significance are then rolled out for live release.
One important thing to keep in mind for NFL prop betting purposes is that books generally shade their lines heavily toward the "over" side of a given market.
Over a sample of over 12,000 bets across three seasons, the “under” side hit at a 56% rate despite offering slightly longer average odds. Thus, while our models are designed to be well-calibrated, the nature of the books’ offerings means that the suggested wagers will be on the “under” side more often than not.

Passing Yards
Model Performance Summary
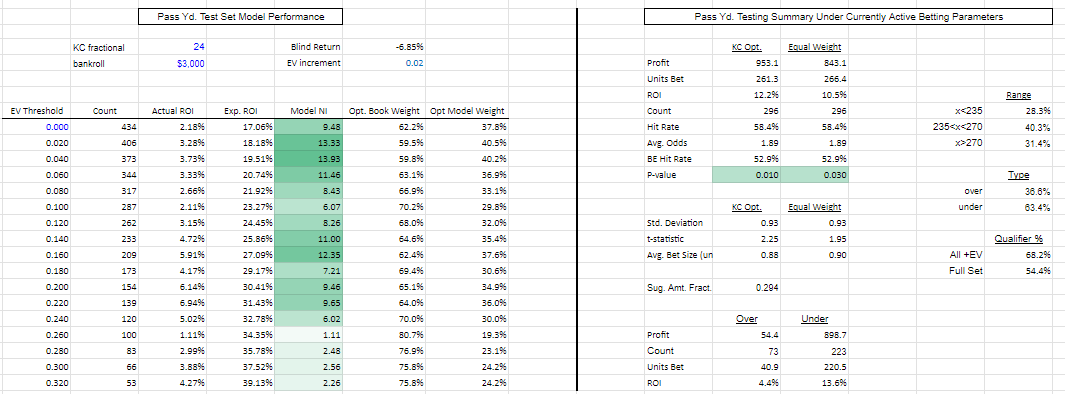
All Test Datapoints

Passing Attempts
Model Performance Summary
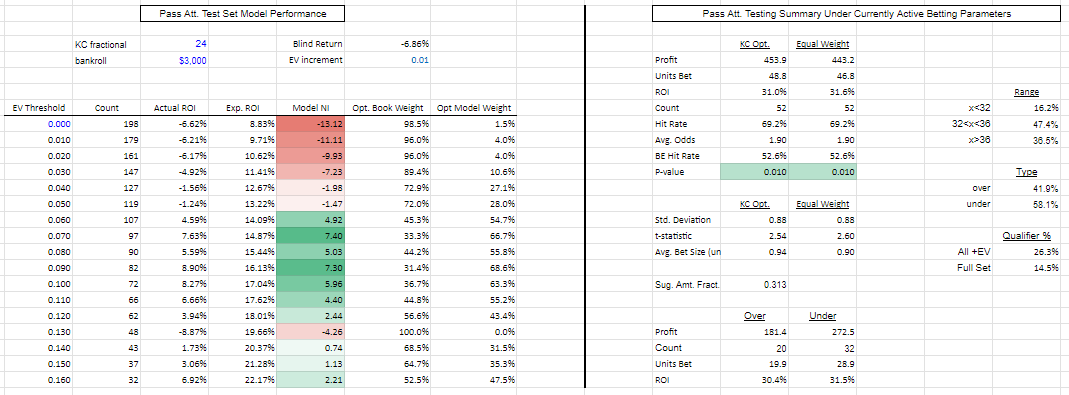
All Test Datapoints

Passing TDs
`
Model Performance Summary
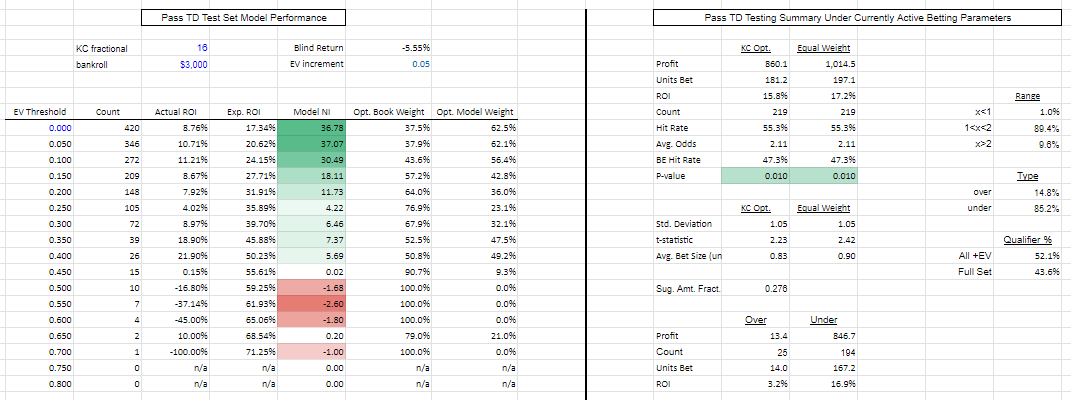
All Test Datapoints

Interceptions Thrown
Model Performance Summary
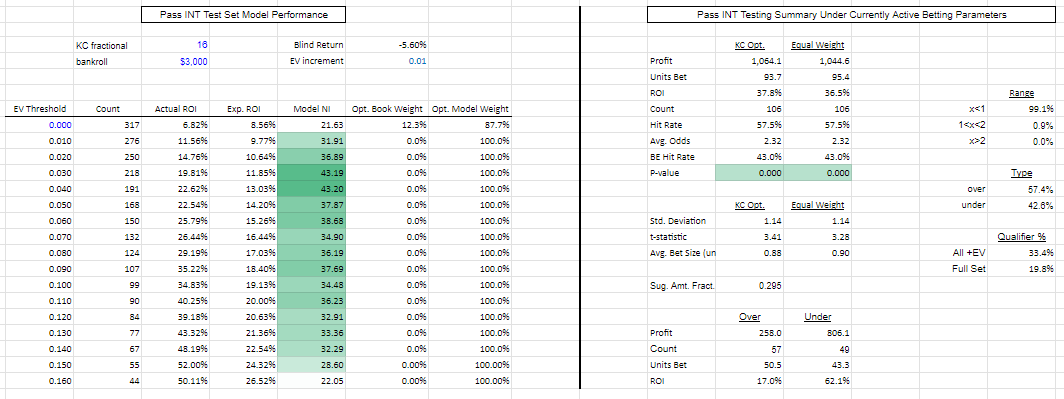
All Test Datapoints
Rushing Yards
Model Performance Summary
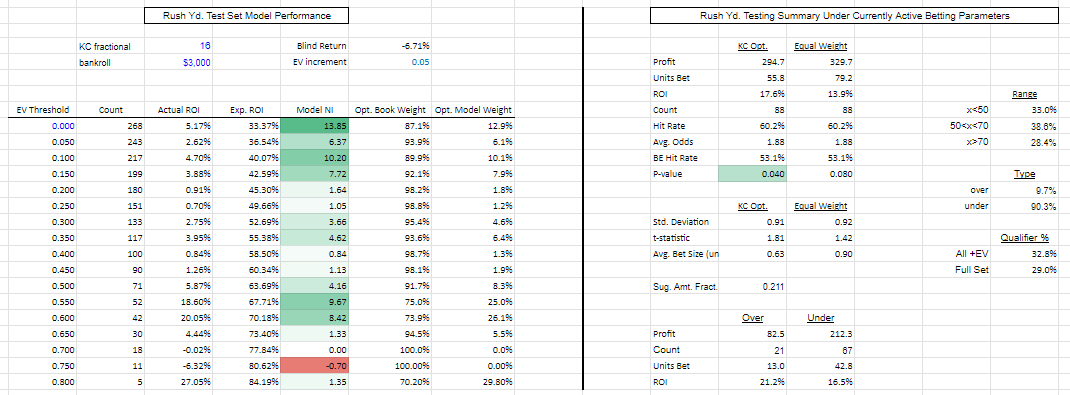
All Test Datapoints

Receptions
Model Performance Summary
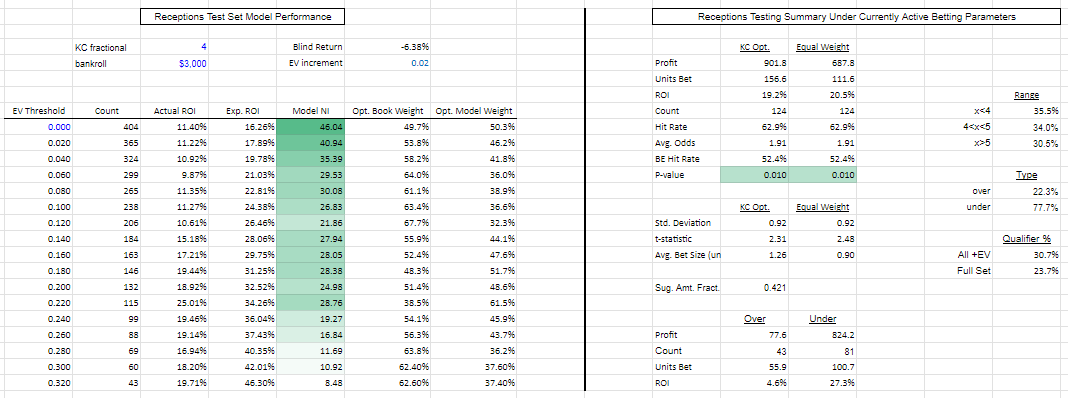
All Test Datapoints

Receiving Yards
Model Performance Summary
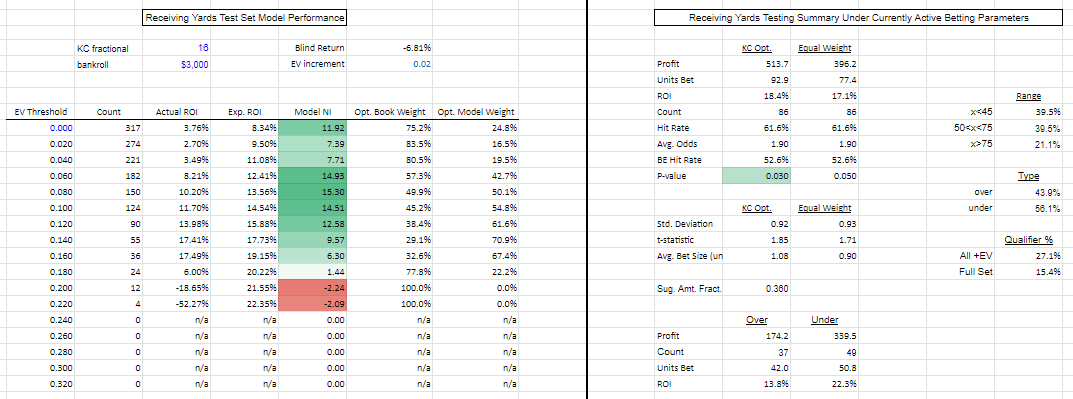
All Test Datapoints

Anytime TD Scorer - RB
Model Performance Summary
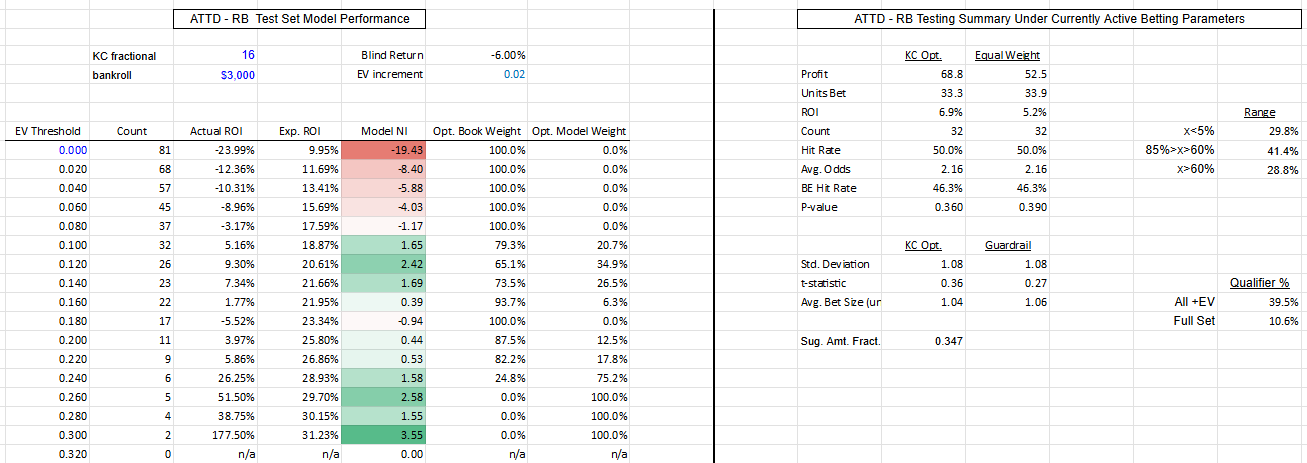
All Test Datapoints
*No separate test data set for this market; set was built over course of season and will be added to in years ahead
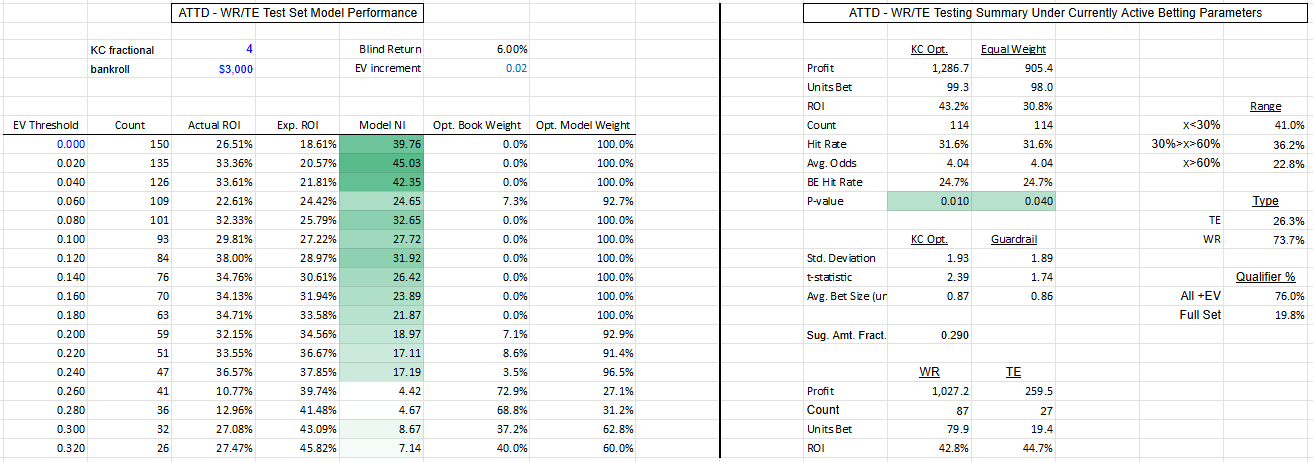
Anytime TD Scorer - WR/TE
Model Performance Summary