MLB Player Projection Models: Intro & Test Data
Our approach to the sport that started the analytics revolution.


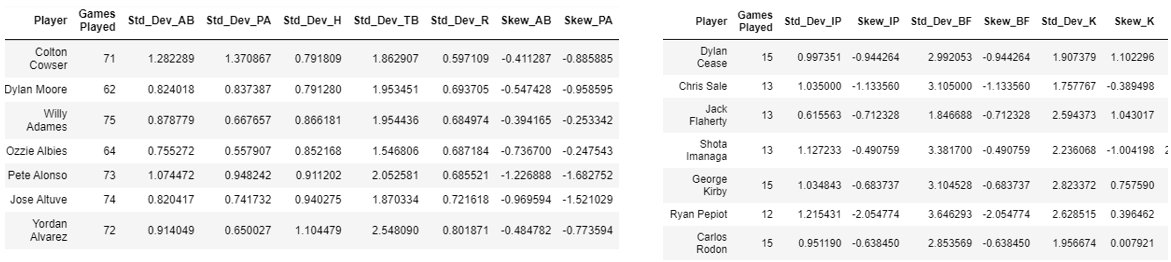
Our MLB player props combine player-specific projections and success rates with market-based adjustments for team stat totals to derive estimates for each box score item. Player consistency in these stat totals can vary widely based on things like their typical place in the batting order or how quick the manager is to give a struggling pitcher the hook, so each measure is calculated for each unique player-stat item combination (see examples below). To account for the significant randomness in baseball, as well for the relatively few datapoints per season for pitchers, these calculations are then regressed to league averages with a dynamic weighting system based on games played.
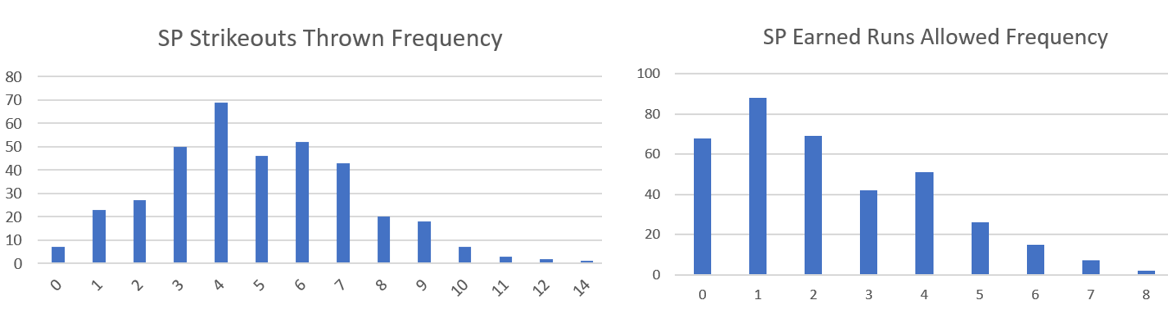
Given the Markovian and zero-inflated nature of many baseball stat items, converting these raw projections into probabilities for wagering purposes is particularly tricky here. To illustrate, see the significant difference in shape between the K and ER distributions below - they obviously require different conversion methods. A variety of both discrete and continuous distributions are tested for each market to determine which produces the best accuracy and calibration. Once these final probability estimates are generated, we compare them to the odds-implied probabilities in the same manner as with other models in order to identify plus-EV wagering opportunities.

Total Bases
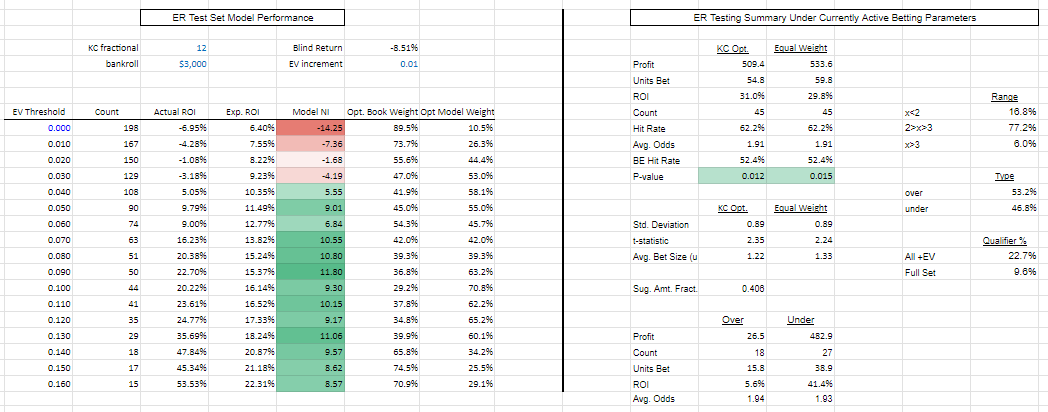
Model Performance Summary
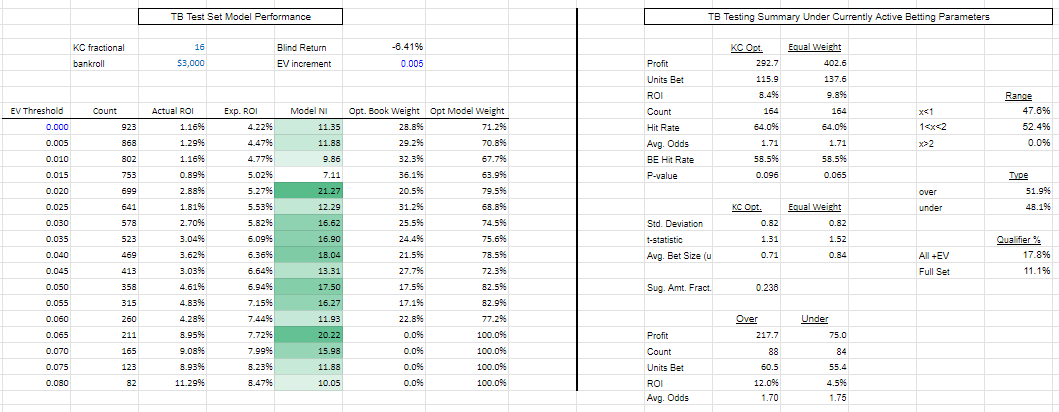
All Test Datapoints

Runs Scored
Model Performance Summary
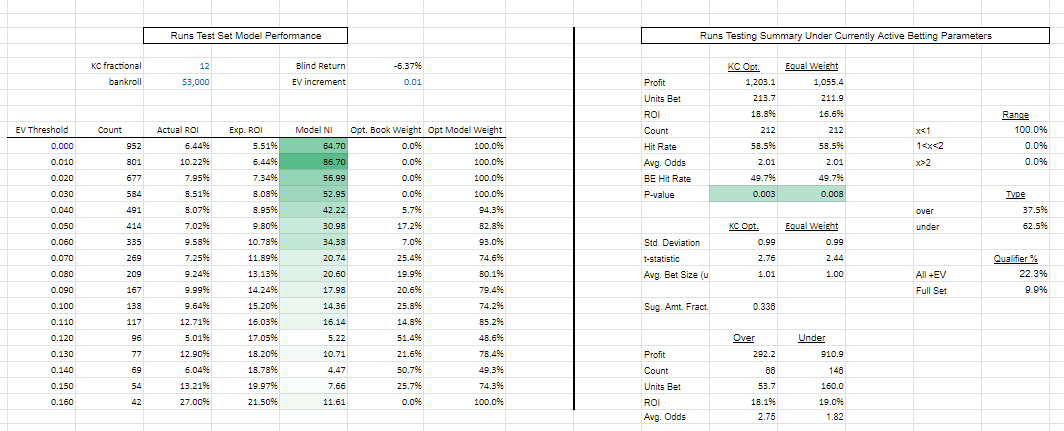
All Test Datapoints

Strikeouts Thrown
Model Performance Summary
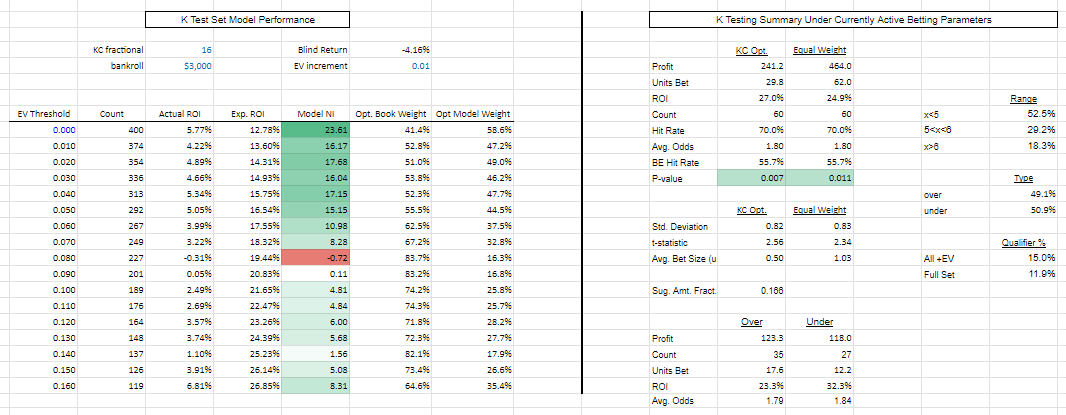
All Test Datapoints
`
Earned Runs Allowed
Model Performance Summary